Modelling the Impact of Early Objetives in League of Legends
tl;dr: If you’re just interested in the results you can skip right to the Results section.
In this notebook I analyze around 120k League of Legends matches from the EU-West server. The matches have been acquired through the League of Legends REST API provided by Riot. The code for the bayesian logistic regression and the correlation matrix is based on the code from the post “GLM: Logistic Regression” on the pymc website.
There is no API endpoint for downloading a list off all played matches. Instead one has to start with some user - called summoners in League of Legends and get a list of the last 100 (the maximum per call) matches played by that user. Then for each of those the detailed match statistics can be downloaded and saved. The search for more matches continues with the other players that played in the discovered matches. This process can continue infinitely always grabbing the latest matches for each player as the graph of players connected by common matches is traversed. Alternatively, one can save the user ID for each user that was already crawled to essentially perform graph colloring. The process would stop once no new users are discoverd. Of course, this assumes that each user is reachable from every other user in the graph.
I wrote a Python tool for downloading the matches details in the outlined procedure. I will write a post about it when I find the time.
The notebook for this code can be found in my notebooks repository. The code for parsing the predictor variables from the match details JSON is included, but the data can also be loaded from a saved numpy array. I include this saved numpy array in the repository since is much smaller than the raw JSON data.
The Goal
For this post I’m interested in the impact of early objectives on the final outcome of a match. The early objectives are for example:
- whether the team got the first tower
- whether the team got the first dragon
- whether the lanes have a gold lead over their lane opponents
We want to use those predictors predictors to predict the outcome of a match. This gives us two nice results:
- If the model has decent accuracy we can use it to predict the outcome of matches early on.
- We can use the estimated weights for each predictor to assess the impact that it has.
Hopefully this will give some nice insights into which objectives are most valuable and should be contested and not given up to the opposing team.
Imports
%matplotlib inline

from concurrent.futures import ThreadPoolExecutor, as_completed
from functools import partial
from json import load as json_load
from joblib import dump as joblib_dump
from joblib import load as joblib_load
from operator import itemgetter
from os import listdir, remove
from os.path import expanduser, isfile, join, exists, isfile
from time import sleep


import numpy as np
import pandas as pd
import pymc3 as pm
import matplotlib.pyplot as plt
import seaborn as sb
from IPython.display import clear_output, display
Loading the Data
Define Feature Extractors
Here I define a set of generalized extractor functions which are used to get some type of feature from a specific sub-section of the JSON data for a match.
The function get_features_and_extractors() uses these functions to return a list of the feature extractores that are going to be run on each match JSON along wiht a feature name and data type.
_extract_indicator_from_teams extracts an indicator (a boolean variable) from the overall team statistic of both teams and combines them into a single predictor. The predictor is “+1” if the red team got the objective, “0” if no team got it and “-1” if the blue team got it.
_extract_participant_stat extracts the difference of some metric between the blue and red team’s players. This is used for example to extract the assists for the taking down the first tower and would be positive if the red team took down the first tower (e.g. +2 with two assists).
_extract_participant_timeline_key extracts a statistic from the timeline of the specified team and lane. For example extract the gold difference for minutes 10-20 for the blue middle lane.
extract_red_win simply extracts whether the red team wins.
get_features_and_extractors defines the following features using the above functions:
| predictor | description |
|---|---|
| firstDragon firstRiftHerald firstBlood firstTower | +1 if the red team got the first of the respective objective, -1 of the blue team got it, and 0 if no team got the objective. |
| anyFirstTowerAssist | +1 if the red team got the first tower with assist, -1 if the blue team got it with assist. |
| sumFirstTowerAssist | +n if n players assisted when the red team took first twoer, -n if blue team took first tower. |
| goldPerMinDeltasTop10 goldPerMinDeltasMiddle10 goldPerMinDeltasBottom10 goldPerMinDeltasJungle10 | The gold difference during the first 10 minutes of the game between each lane’s oponents (2 for each side in the bottom lane). |
| xpPerMinDeltasTop10 xpPerMinDeltasMiddle10 xpPerMinDeltasBottom10 xpPerMinDeltasJungle10 | The experience difference during the first 10 minutes of the game between each lane’s oponents (2 for each side in the bottom lane). |
| creepsPerMinDeltasTop10 creepsPerMinDeltasMiddle10 creepsPerMinDeltasBottom10 creepsPerMinDeltasJungle10 | The creep score (CS) difference during the first 10 minutes of the game between each lane’s oponents (2 for each side in the bottom lane). |
| damageTakenPerMinDeltasTop10 damageTakenPerMinDeltasMiddle10 damageTakenPerMinDeltasBottom10 damageTakenPerMinDeltasJungle10 | The difference of the damage taken during the first 10 minutes of the game between each lane’s oponents (2 for each side in the bottom lane). |
def _extract_indicator_from_teams(key: str, match_details: dict) -> int:
    indicator = 0
    for team in match_details['teams']:
        if team['teamId'] == 100:
            indicator -= team[key]
        else:
            indicator += team[key]
    return indicator

def _extract_participant_stat(aggregator: callable, key: str, match_details: dict) -> int:
    blue = aggregator(
        participant['stats'][key] if key in participant['stats'] else 0
        for participant in match_details['participants']
        if participant['teamId'] == 100)

    red = aggregator(
        participant['stats'][key] if key in participant['stats'] else 0
        for participant in match_details['participants']
        if participant['teamId'] == 200)

    return red-blue

def _extract_participant_timeline_key(team_id: int, lane: str, key: str, frame: str, match_details: dict):
    '''
    - team_id (int): Possible values are 100 (blue)
        and 200 (red).

    - lane (str): Possible values are 'MIDDLE', 'TOP',
        'JUNGLE' and 'BOTTOM'.

    - key (str): Possbile values are 'goldPerMinDeltas',
        'creepsPerMinDeltas', 'xpPerMinDeltas' and
        'damageTakenPerMinDeltas'

    - frame (str): Possible values are '0-10', '10-20',
        '20-30' and '30-end'.

    - match_details (dict): whole dictionary of parse
        match json.
    '''
    metric = 0.0  # sum because two players are bottom

    for participant in match_details['participants']:
        is_lane = participant['timeline']['lane'] == lane
        is_team = participant['teamId'] == team_id

        if is_lane and is_team:
            try:
                metric += participant['timeline'][key][frame]
            except KeyError:
                return np.nan

    return metric

def extract_red_win(match_details: dict) -> bool:
    team = match_details['teams'][0]

    if team['teamId'] == 100:  # blue
        if team['win'] == 'Win':
            return False
        else:
            return True
    else:  # red
        if team['win'] == 'Win':
            return True
        else:
            return False

team_to_text = {100: 'blue', 200: 'red'}

def generate_participant_timeline_extractors(team_ids: (int,), lanes: (str,), keys: (str,), frames: (str,)):
    for team_id in (100, 200):
        for lane in ('BOTTOM', 'MIDDLE', 'TOP', 'JUNGLE'):
            for key in ('goldPerMinDeltas', 'creepsPerMinDeltas', 'xpPerMinDeltas', 'damageTakenPerMinDeltas'):
                for frame in ('0-10',):
                    yield (
                        f"{key}{team_to_text[team_id].title()}{lane.title()}{frame.split('-')[-1]}",
                        'f4',
                        partial(_extract_participant_timeline_key, team_id, lane, key, frame)
                    )

def get_features_and_extractors() -> ((str, type, callable),):
    return (
        ('redWin', 'i1', extract_red_win),

        ('firstDragon', 'f4', partial(_extract_indicator_from_teams, 'firstDragon')),
        ('firstRiftHerald', 'f4', partial(_extract_indicator_from_teams, 'firstRiftHerald')),

        ('firstBlood', 'f4', partial(_extract_indicator_from_teams, 'firstBlood')),
        ('anyFirstBloodAssist', 'f4', partial(_extract_participant_stat, any, 'firstBloodAssist')),
        ('sumFirstBloodAssist', 'f4', partial(_extract_participant_stat, sum, 'firstBloodAssist')),

        ('firstTower', 'f4', partial(_extract_indicator_from_teams, 'firstTower')),
        ('anyFirstTowerAssist', 'f4', partial(_extract_participant_stat, any, 'firstTowerAssist')),
        ('sumFirstTowerAssist', 'f4', partial(_extract_participant_stat, sum, 'firstTowerAssist'))
    )+tuple(
        extractor for extractor in
        generate_participant_timeline_extractors(
            (100, 200),
            ('BOTTOM', 'MIDDLE', 'TOP', 'JUNGLE'),
            ('goldPerMinDeltas', 'creepsPerMinDeltas', 'xpPerMinDeltas', 'damageTakenPerMinDeltas'),
            ('0-10',)
        )
    )
Loading Data
The data is in a folder with one file per match. The files are JSON encoded and named {matchID}.json.
def load_matches_from_folder(base_path: str, features: ((str, type, callable),)):
    filelist = listdir(base_path)

    data = np.zeros(len(filelist), dtype=[(f, t) for f, t, _ in features])


    type_to_default = {'i1': -128, 'f4': np.nan}
    for f, t, _ in features:
        data[f] = type_to_default[t]

    print(f"loading max. {len(filelist)} files")

    def load_and_parse_match_details(file_i: int, base_path: str, file_name: str):
        file_path = join(base_path, file_name)

        if isfile(file_path):
            with open(file_path, 'r') as match_file:
                match_details = load(match_file)

            if not match_details['queueId'] in (420, 440):
                remove(file_path)
            else:
                for feature, _, extractor in features:
                    try:
                        data[feature][file_i] = extractor(match_details)
                    except Exception as exception:
                        print(f"error parsing feature {feature} for {file_name}")
                        raise

        return file_i

    max_file_done = 0

    with ThreadPoolExecutor(max_workers=4) as executor:

        print(f"using {executor._max_workers} threads")

        futures = tuple(
            executor.submit(load_and_parse_match_details, file_i, base_path, file_name)
            for file_i, file_name in enumerate(filelist)
            if file_name.endswith('.json')
        )

        print(f"submitted all {len(futures)} to the executor")

        for future in as_completed(futures):
            try:
                file_i = future.result()
            except Exception as exception:
                executor.shutdown()
                print(f"error parsing files - {exception}")
                raise
            else:
                max_file_done = max(max_file_done, file_i)
                if file_i%1000 == 0 or max_file_done+1==len(filelist):
                    clear_output(wait=True)
                    display(f"{100.0*float(max_file_done+1)/float(len(filelist)):>5.1f}%")

    return data
Check if there is any saved numpy file. If not, load match data from a folder from disk. If a saved numpy file is found notify the user that cached data is used.
features_path = join(expanduser('~'), 'Downloads', '20190208-logistic-features.joblib')
data_path = join(expanduser('~'), 'Downloads', '20190208-logistic.joblib')
if exists(features_path) and exists(data_path) and isfile(features_path) and isfile(data_path):
    features = joblib_load(features_path)
    data = joblib_load(data_path)
    print(f"LOADED CACHED DATA FROM {data_path}")
else:
    features = get_features_and_extractors()
    data = load_matches_from_folder(join(expanduser('~'), 'Downloads', 'lol_matches'), features)
LOADED CACHED DATA FROM /Users/{user}/Downloads/20190208-logistic.joblib
Pre-Processing
Add Computed Features
def generate_computed_feature_names(features: ((str, type, callable))):
    for key in ('goldPerMinDeltas', 'creepsPerMinDeltas', 'xpPerMinDeltas', 'damageTakenPerMinDeltas'):
        for lane in ('BOTTOM', 'MIDDLE', 'TOP', 'JUNGLE'):
            k1 = f"{key}Red{lane.title()}10"
            k2 = f"{key}Blue{lane.title()}10"
            feature_name = f"{key}{lane.title()}10"
            if feature_name in map(itemgetter(0), features):
                continue
            yield feature_name, 'f4', lambda d: d[k1]-d[k2]

new_data = np.zeros(len(data), dtype=[(f, t) for f, t, _ in features+tuple(generate_computed_feature_names(features))])

for f, _, _ in features:
    if f in data.dtype.names:
        new_data[f] = data[f]

for f, _, e in generate_computed_feature_names(features):
    new_data[f] = e(new_data)

data = new_data

features = features+tuple(generate_computed_feature_names(features))
Cleanup
Remove matches that have any NaN values.
missing_mask = np.zeros(len(data), dtype=np.bool)

for f, _, _ in features:
    missing_mask |= np.isnan(data[f])

data = data[~missing_mask].copy()
Remove matches without first blood or first tower. These presumably were not played to the end.
data = data[:][((data['firstBlood'] != 0) | (data['firstTower'] != 0))].copy()
Drop any columns that only have one value. They provide no information at all.
keep_columns = []
for f, _, _ in features:
    if f not in data.dtype.names:
        continue
    if not (data[f] == data[f][0]).all():
        keep_columns.append(f)
    else:
        print(f"dropping {f}")

data = data[keep_columns].copy()

features = tuple(f for f in features if f[0] in keep_columns)
Scale Predictors
Scale the prdictors to have an expected value of 0 and standard deviation of 1.
for f, _, _ in features:
    if f == 'redWin':
        continue
    data[f] = (data[f]-np.mean(data[f]))/np.std(data[f])
Save the Data and Features
_ = joblib_dump(data, join(expanduser('~'), 'Downloads', '20190208-logistic.joblib'))
_ = joblib_dump(tuple((f, t, None) for f, t, _ in features),
            join(expanduser('~'), 'Downloads', '20190208-logistic-features.joblib'))
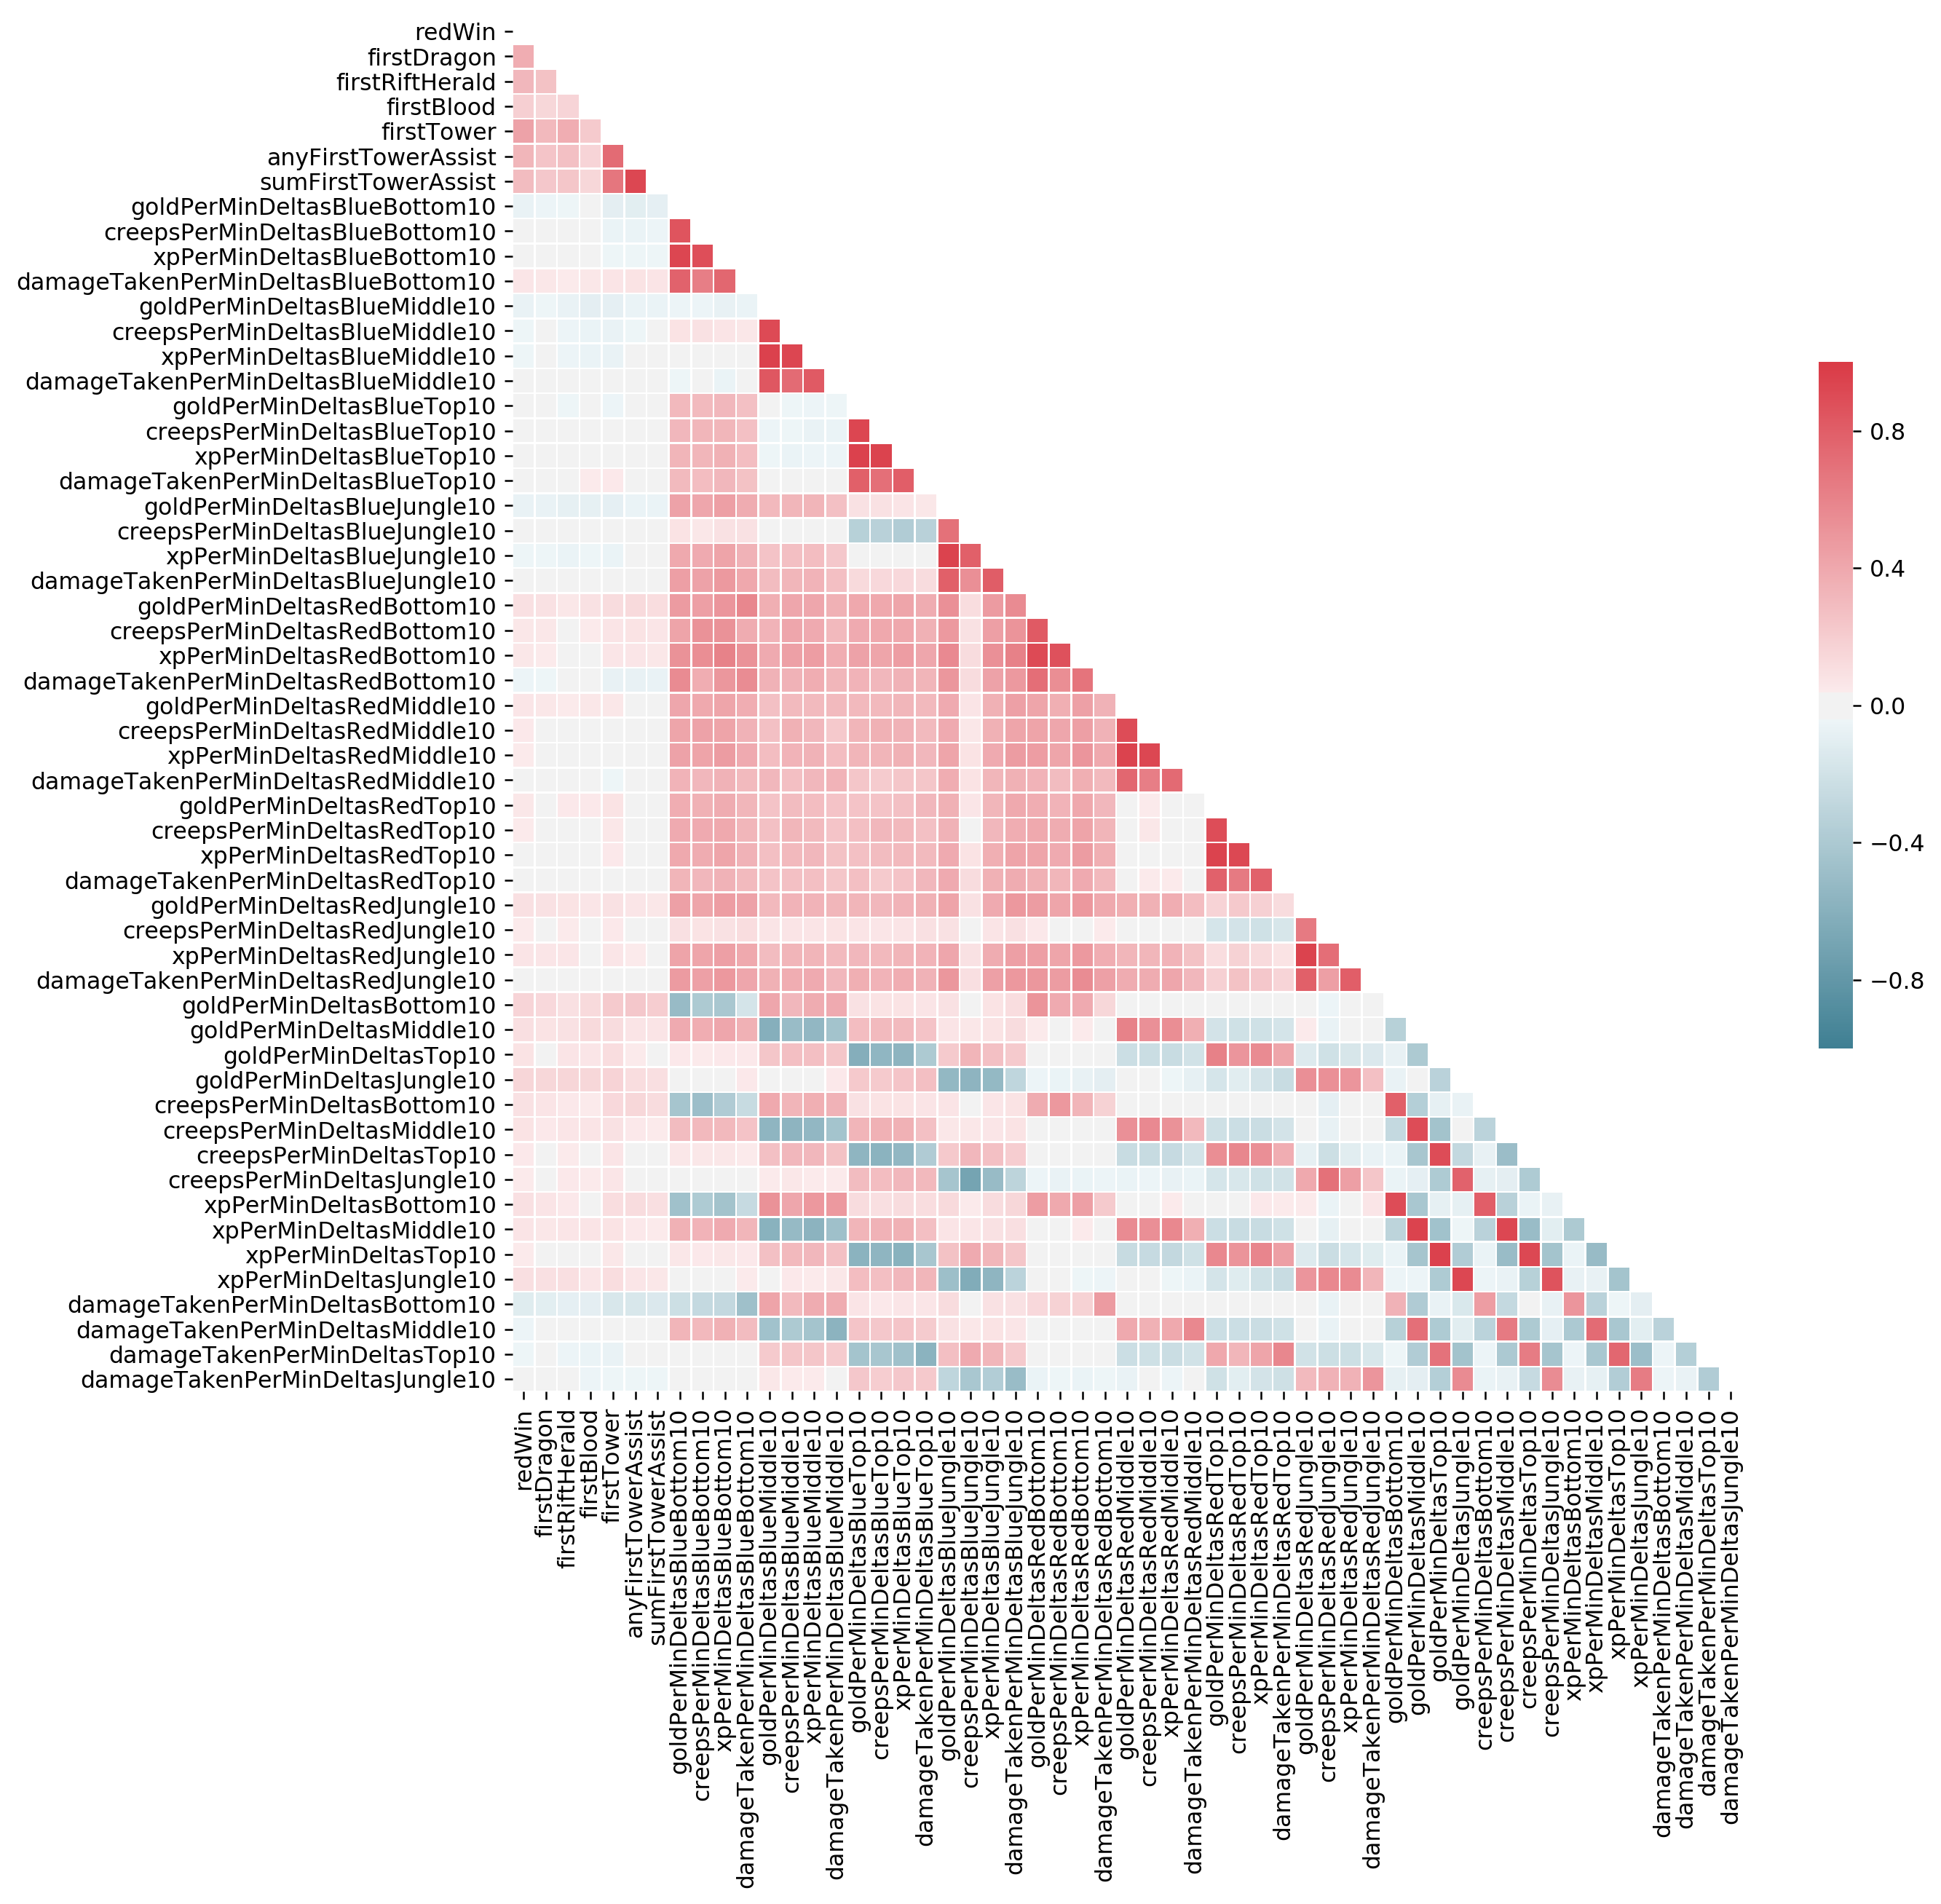
Exploring the Data
# Compute the correlation matrix
corr = np.zeros((len(features), len(features)), dtype='float32')

for f1_i, (f1, _, _) in enumerate(features):
    for f2_i, (f2, _, _) in enumerate(features):
        corr[f1_i, f2_i] = np.corrcoef(data[f1], data[f2])[0, 1]

# Generate a mask for the upper triangle
mask = np.zeros_like(corr, dtype=np.bool)
mask[np.triu_indices_from(mask)] = True

# Set up the matplotlib figure
f, ax = plt.subplots(figsize=(12, 11))
f.set_dpi(227.0)

# Generate a custom diverging colormap
cmap = sb.diverging_palette(220, 10, as_cmap=True)

# Draw the heatmap with the mask and correct aspect ratio
_ = sb.heatmap(
    corr, mask=mask, cmap=cmap, vmin=-1, vmax=1,
    linewidths=.5, cbar_kws={"shrink": .5},
    ax=ax, # annot=True,
    xticklabels=tuple(f for f, _, _ in features),
    yticklabels=tuple(f for f, _, _ in features))
Logistic Model
Generate Training & Test Split
def create_tr_te_split(data: np.ndarray, target_variable: str, tr_pct: float = 0.6):
    # feature_vars = tuple(f for f in data.dtype.names if f != target_variable)

    tr_te_split = int(len(data)*tr_pct)

    X_tr = np.zeros(tr_te_split, dtype=[(f, 'f4') for f in data.dtype.names])
    y_tr = np.zeros(tr_te_split, dtype='bool')

    X_te = np.zeros(len(data)-tr_te_split, dtype=[(f, 'f4') for f in data.dtype.names])
    y_te = np.zeros(len(data)-tr_te_split, dtype='bool')

    for f in data.dtype.names:
        X_tr[f] = data[f][:tr_te_split]
        X_te[f] = data[f][tr_te_split:]

    return X_tr, X_te

X_tr, X_te = create_tr_te_split(data, 'redWin')

del data
Define & Train the Model
feature_names = (
    f for f, _, _
    in features
    if f != 'redWin'
    and 'Red' not in f
    and 'Blue' not in f
)
model_equation = f"redWin ~ {' + '.join(feature_names)}"
indent = ' '.join('' for _ in range(len(model_equation.split('~')[0])+1))
print(model_equation.replace('+', f"\n{indent}+"), end='\n\n')
del feature_names
del indent
redWin ~ firstDragon
       + firstRiftHerald
       + firstBlood
       + firstTower
       + anyFirstTowerAssist
       + sumFirstTowerAssist
       + goldPerMinDeltasBottom10
       + goldPerMinDeltasMiddle10
       + goldPerMinDeltasTop10
       + goldPerMinDeltasJungle10
       + creepsPerMinDeltasBottom10
       + creepsPerMinDeltasMiddle10
       + creepsPerMinDeltasTop10
       + creepsPerMinDeltasJungle10
       + xpPerMinDeltasBottom10
       + xpPerMinDeltasMiddle10
       + xpPerMinDeltasTop10
       + xpPerMinDeltasJungle10
       + damageTakenPerMinDeltasBottom10
       + damageTakenPerMinDeltasMiddle10
       + damageTakenPerMinDeltasTop10
       + damageTakenPerMinDeltasJungle10
with pm.Model() as logistic_model:
    pm.glm.GLM.from_formula(model_equation, X_tr, family=pm.glm.families.Binomial())
    print(logistic_model.check_test_point())
    trace_logistic_model = pm.sample(
        2000,
        chains=None,
        tune=1000)
Save the Model Trace
 pm.backends.ndarray.save_trace(
     trace_logistic_model,
     directory=join(expanduser('~'), 'Dropbox', 'lol-analysis',
                    '20190208-logistic-difference-lane-factors', 'model'),
     overwrite=False)
Results
Estimated Posterior Distribution of Objective Weights
def plot_traces(traces, retain=1000):
    '''
    Convenience function:
    Plot traces with overlaid means and values
    '''

    ax = pm.traceplot(traces[-retain:], figsize=(12, len(traces.varnames)*1.5),
        lines={k: v['mean'] for k, v in pm.summary(traces[-retain:]).iterrows()})

    for i, mn in enumerate(pm.summary(traces[-retain:])['mean']):
        ax[i,0].annotate(
            f"{mn:.2f}", xy=(mn,0), xycoords='data',
            xytext=(5,10), textcoords='offset points',
            rotation=90,va='bottom', fontsize='large',
            color='#AA0022')

plot_traces(trace_logistic_model, retain=1000)
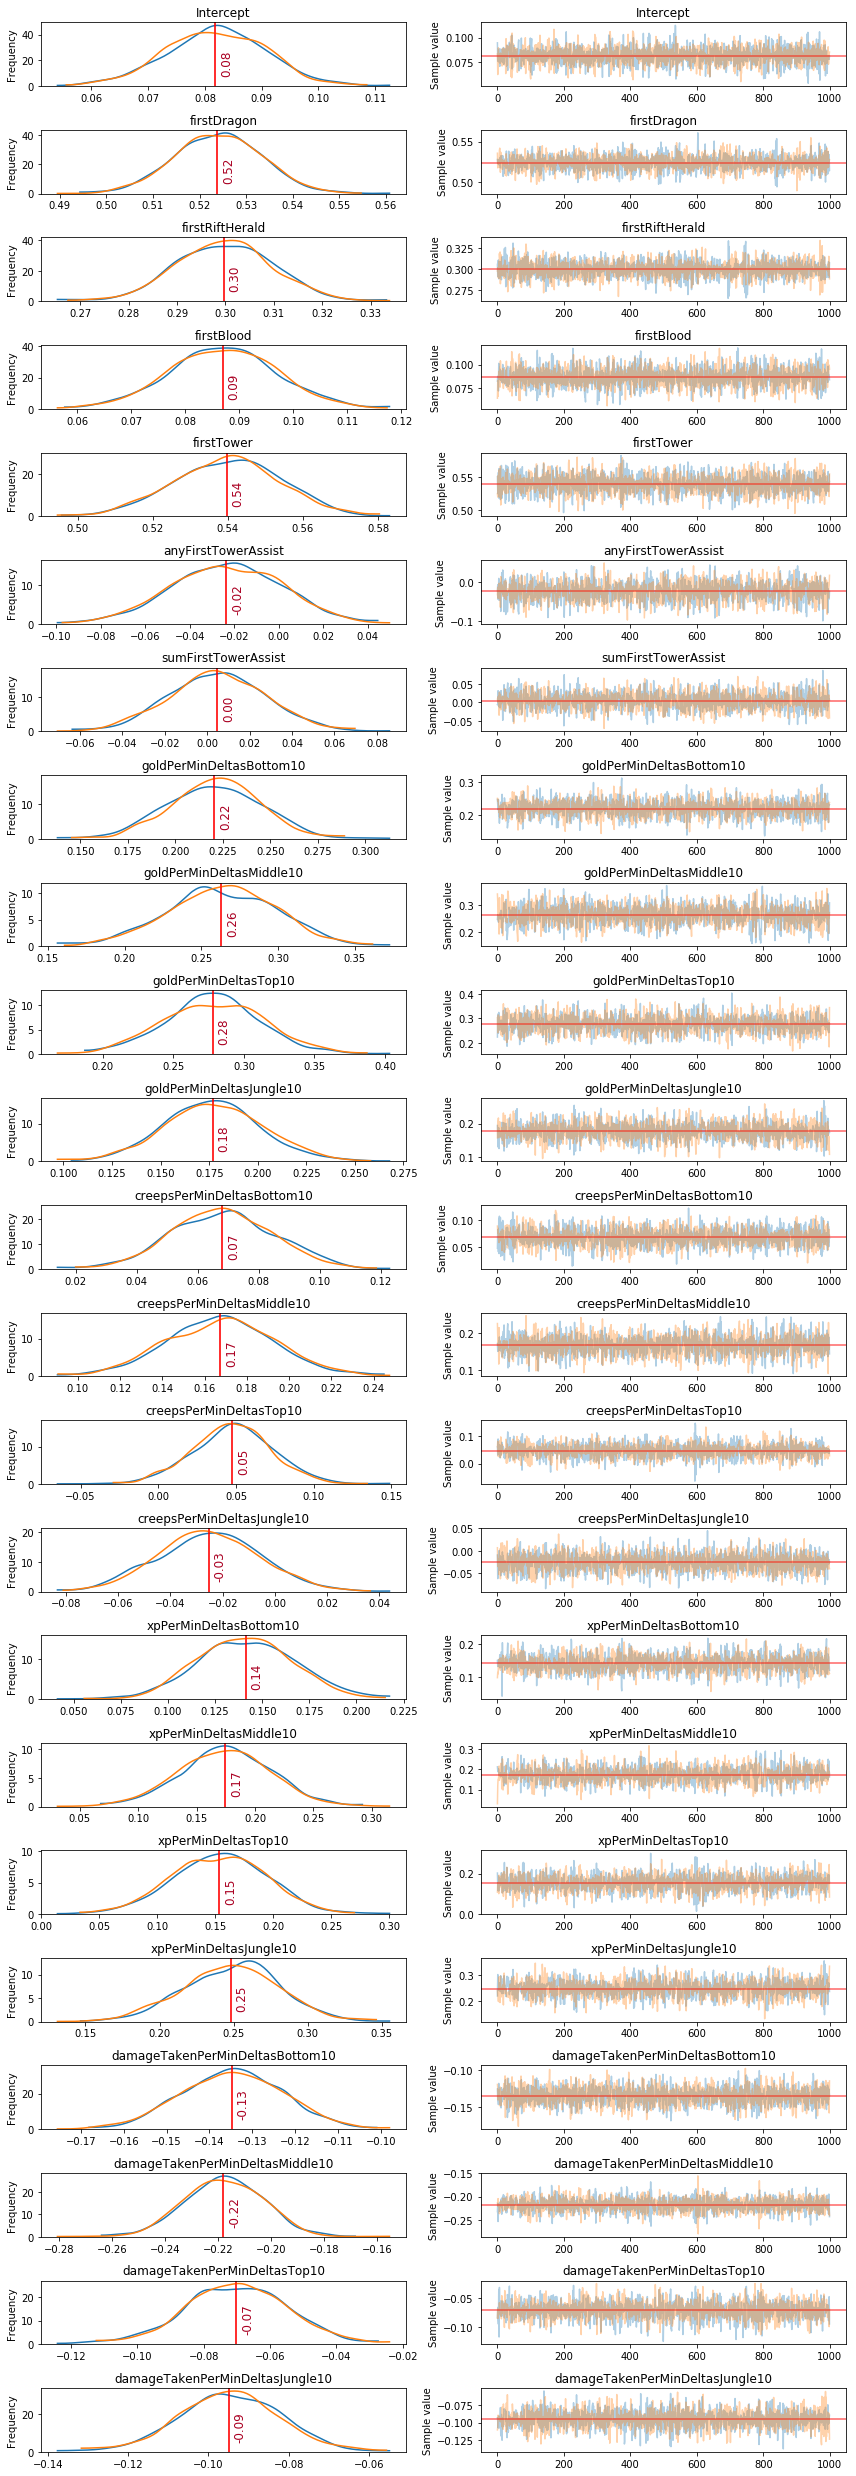
Estimated Mean of Objective Weights
for mean, name in sorted(zip(pm.summary(trace_logistic_model[-1000:])['mean'], trace_logistic_model.varnames), reverse=True):
    print(f"{name:>35}: {mean:5.2f}")
                         firstTower:  0.54
                        firstDragon:  0.52
                    firstRiftHerald:  0.30
              goldPerMinDeltasTop10:  0.28
           goldPerMinDeltasMiddle10:  0.26
             xpPerMinDeltasJungle10:  0.25
           goldPerMinDeltasBottom10:  0.22
           goldPerMinDeltasJungle10:  0.18
             xpPerMinDeltasMiddle10:  0.17
         creepsPerMinDeltasMiddle10:  0.17
                xpPerMinDeltasTop10:  0.15
             xpPerMinDeltasBottom10:  0.14
                         firstBlood:  0.09
                          Intercept:  0.08
         creepsPerMinDeltasBottom10:  0.07
            creepsPerMinDeltasTop10:  0.05
                sumFirstTowerAssist:  0.00
                anyFirstTowerAssist: -0.02
         creepsPerMinDeltasJungle10: -0.03
       damageTakenPerMinDeltasTop10: -0.07
    damageTakenPerMinDeltasJungle10: -0.09
    damageTakenPerMinDeltasBottom10: -0.13
    damageTakenPerMinDeltasMiddle10: -0.22
Posterior Predictive Checks
Load the Model Trace & Predict
Recreate the same logistic model and load the model trace from permanent stoarge to perform posterior predictive checks.
with pm.Model() as logistic_model:
    pm.glm.GLM.from_formula(model_equation, X_te, family=pm.glm.families.Binomial())
    trace_logistic_model = pm.backends.ndarray.load_trace(
         join(expanduser('~'), 'Dropbox', 'lol-analysis',
              '20190208-logistic-difference-lane-factors', 'model'),
         model=logistic_model)
    ppc = pm.sample_ppc(trace_logistic_model, model=logistic_model, samples=1000)
100%|██████████| 1000/1000 [00:12<00:00, 79.16it/s]
Accuracy & F1 Score
from sklearn.metrics import roc_curve, auc, f1_score, accuracy_score

y_pred = np.mean(ppc['y'], axis=0) > 0.5

print(f"accuracy: {100.0*accuracy_score(X_te['redWin'], y_pred):>4.1f}%")
print(f"f1 score: {f1_score(X_te['redWin'], y_pred):>4.3f}")

fpr, tpr, thresholds = roc_curve(X_te['redWin'], np.mean(ppc['y'], axis=0))
roc_auc = auc(fpr, tpr)
accuracy: 74.6%
f1 score: 0.753
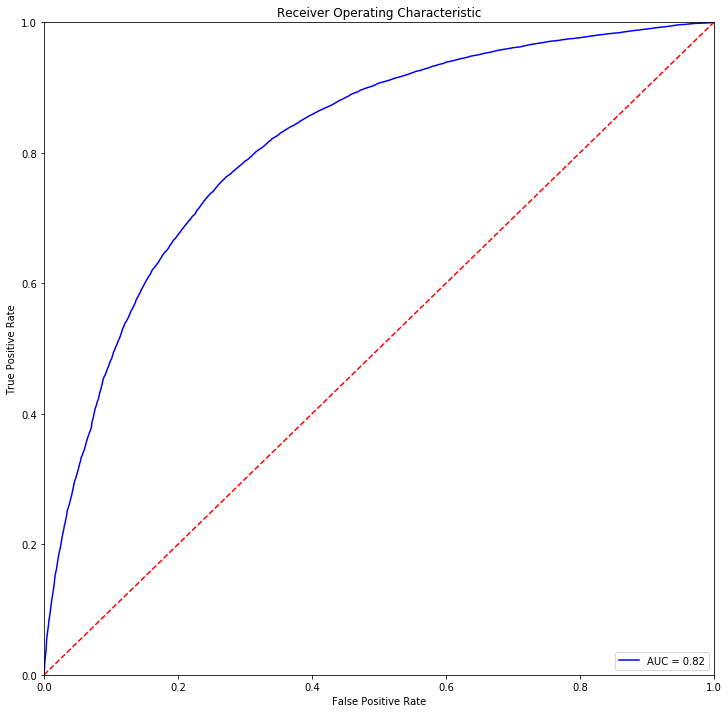
ROC Curve
import matplotlib.pyplot as plt
%matplotlib inline

figure = plt.figure(figsize=(12,12))
axis = figure.gca()

_ = axis.set_title('Receiver Operating Characteristic')
_ = axis.plot(fpr, tpr, 'b', label = f"AUC = {roc_auc:0.2f}")
_ = axis.legend(loc = 'lower right')
_ = axis.plot([0, 1], [0, 1],'r--')
_ = axis.set_xlim([0, 1])
_ = axis.set_ylim([0, 1])
_ = axis.set_ylabel('True Positive Rate')
_ = axis.set_xlabel('False Positive Rate')